Are you an extremist?
You most likely would answer “No” to such a question.
I have some disturbing news…
I’ve been reading recently the excellent book “Hands-On Machine Learning with Scikit-Learn & TensorFlow” and one of the very interesting concepts mentioned in the book is that of “Curse of Dimensionality”. Specifically it deals with some very bizarre and unexpected behaviour when dealing with sets over a large number of dimensions.
Let’s start with a simple question, like “Are you happy?”. Let’s supposed you give this to people and they can rate their perception of happiness on a scale from 0 (extremely unhappy) to 1 (extremely happy). The choice for this representation is only to simplify some formulas later.
Let’s suppose we define a concept of “extreme” by marking the answers that are close to the two borders of the representation (0 and 1) by a certain rate. With my excellent drawing skills I would represent this in the following way:

Here the whole segment is of length 1 and let’s say the two ranges at the extreme together make a ratio r for example they are 10% of the whole line, meaning that each of the shaded areas will represent 5% of the segment. The way we would read this information is that 5% of the ratings to the left and 5% of the ratings on the right are “extreme” and together they create a 10% overall rating as “extreme” (as is very often in life the fact that the extreme is to the left or to the right does not seem to matter too much!).
Let’s suppose, for the time being, that we assume a uniform distribution of answers to this question (I will come back to this assumption later) so that we can have a simple relation between how the answers are distributed on the axis and the range where they are reflected. In this case this translates that there is a 10% chance that we will label an answer as being “extremist”.
I was boring until now: we started with a definition of what a 10% extremism is and ended up finding that 10% of the answers are extremists. Not very exciting…
What happens if we increase the number of dimensions? Let’s say that the concept of being happy can be broken down between being happy in your personal life and in your professional life. Now instead of one question (“Are you happy”) we are using two questions: “Are you happy in your personal life?” and “Are you happy in your professional life?”. The more astute readers could already feel that the two questions together might not mean the same thing as the question we had in the first place and we will have a nice discussion about this later on. But let’s assume that the two questions decompose the first question across two dimensions and that they are independent. That means (and we’ll discuss this in a later blog, I promise) that we can represent the new two questions like this:
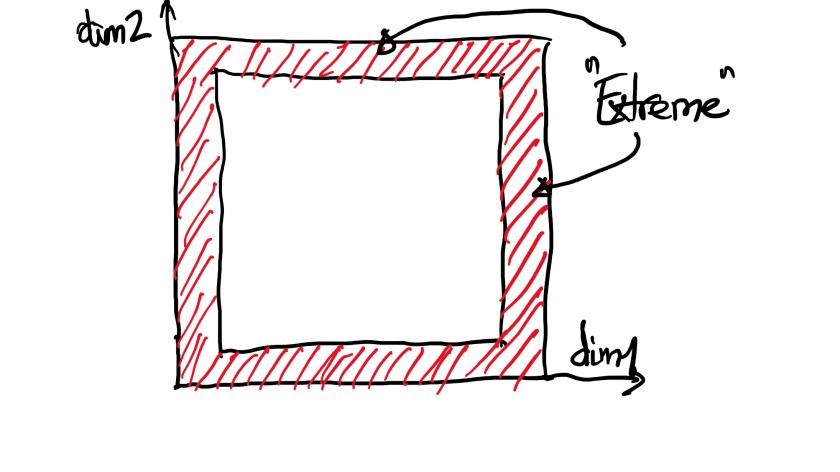
Now we have two orthogonal dimensions (dim1 and dim2) and we would rate the answers to the two questions using the same rule that r (ex. 10%) represents the ratio of the extreme. In this case one is an extremist if the answer to any of the two questions lies in the extreme region. This means that the representation of the extreme is the whole shaded area, something that can be easily understood if we think of extreme as the border of the domain: for the 1D case in fig.1 the border is represented by the two segments at the end of the linear interval, for the 2D case in fig,2 the border is the literal range around the perimeter of the domain.
Considering the same range 0-1 for the answers in the two dimensions (to have the formulas easier to follow) we get that the shaded area is the difference between the outer square (which is 1 because is defined by the maximum values for the ratings) and the inner square, whose area is (1 – r)². In one line:

If we consider r=0.1 (the 10% we used before) it results that p = 0.19 in other words the probability that the rating of one person’s answers to the two questions being “extremist” is 19%. That is not very intuitive! And kind of odd. But if you think about it the way we treat extremism (as being on the border – whatever side of the border) means that it becomes more likely that you either are in the extreme range for one question OR the other. This OR is quite important and is what drives the probability up.
What happens if we add one more dimension? (I will leave the reader to imagine how that question could be phrased to break down one of the existing 2 questions so that it encompasses the meaning of that one question but in the same time the two new questions are independent. We will have a lot of fun later discussing this topic.) Here is my drawing of the 3D case:
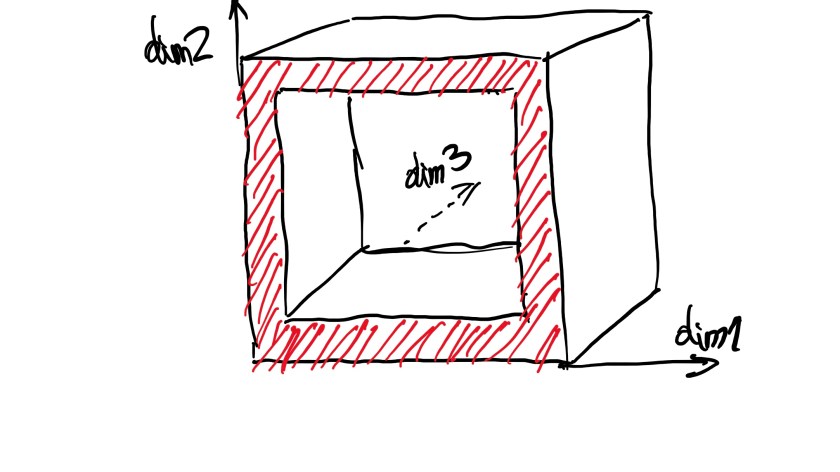
It already is a little problematic to draw the 3D case so I decided to make a trick: imagine that what we see there is a section through the domain. The way you have to visualise the situation in this case is that we have an outer cube of side 1 and a smaller cube of side 1 – r centred inside it. The “extreme” in this case is the “shell” that is obtained by subtracting the inner cube from the outer cube. It’s a 3D extension of the concept of border – in this case the border spans in 3D and is a shell. Keeping the same assumption about the distribution of the answers (uniform) the probability for one person’s answer to be classified in the “extreme” category is:
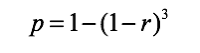
Using the value for r = 0.1 (10%) we obtain (maybe unsurprisingly this time as we started to have a feeling about what’s going on) p = 0.271, in other word 27.1% chances.
Generalising to a number of dimensions d, the formula is therefore:

So, let’s see if we can drive some more insight from this. How many dimensions would I need so that the probability p is bigger than 0.5? That means at how many slicing of the domain space there is more likely to be classified as “extreme” than not? If we put p = 0.5 and do a little bit of algebra (remember the logarithms?) we get d = 6.58 which means for the number of dimensions equal to 7 we have more chances to brand something as extreme than not! This is very unintuitive and seems like a very low number of dimensions. You can play more and check that at 44 dimensions the chances of branding the set of answers as “extreme” grows to 99%! Another way of looking at this, and believe this feels extremely bizarre, is that if you consider the shell or the “peel” of a hyper-cube with 44 dimensions, although the shell is only 10% of each dimension, 99% of the volume of the hyper-cube is in the shell! Everybody (almost) lives at the border!
But those are just mathematical formulas and funny stuff on paper. How does that apply to real life? Quite a lot, it turns out. First when marketing techniques are “segmenting” the market, they are doing exactly this multi-dimensional split of the domain according to their own rules. Then they place you in this universe and train you to respond to the various messages they broadcast. True, some will hate it, but some will love it. And this is where technique is aiming, The deeper the segmentation the more likely you are to behave in an extreme way and that increases the numbers of those that are on the desired side “love it”. There is nothing worse for marketing than people that are in the middle.
The same goes for our electronic social life. It’s been already laboured to death how the algorithms in the social networks are segmenting us by more and more dimensions, driving our responses to be more and more extreme. The math seems to concur on the same conclusion: you have to stop acting from the level of the 44th dimension and perform a “dimensionality reduction”. Almost always this results in more “average” and balanced position.
There are two topics that I have left open in the blog – and I will cover in the next posts. One is the fact that we considered a uniform distribution of the answers in respect to the scoring. The reality is that a more reasonable way to reflect this relation is through a gaussian distribution. We’ll see how that affects the numbers (can you guess?).
The second is related to the fact that the additional dimensions were assumed to be orthogonal (for the formulas to work). What happens if they are not? More importantly what exactly is orthogonality in the case of human beliefs, desires or opinions? Can you really produce 15 orthogonal dimensions that represent “Are you happy?”. That seems like a very hard question.
